Dashboard
The dashboard is the landing page and summary overview of the current period data selected.
Navigation bar
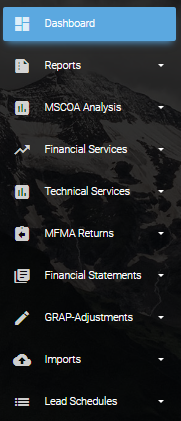
The portal navigation bar is available on the left hand side. Each element has various functionalities and are available via the drop-down:
Setting of periods
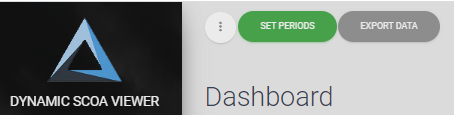
In the top left corner, the ‘Set period’ function can be amended.
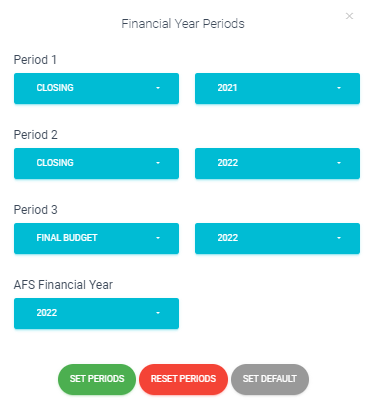
This sets the applicable periods used:
Dashboard graphs
The landing page will show the Dashboard graphs linked to the uploaded Trail Balance, and include a snapshot of:
the Periods selected (set as per above)
Access to summary links such as for mSCOA Financial Summary report, mSCOA Departmental Summary, mSCOA Financial Health, etc (clickable links are set for access or download).

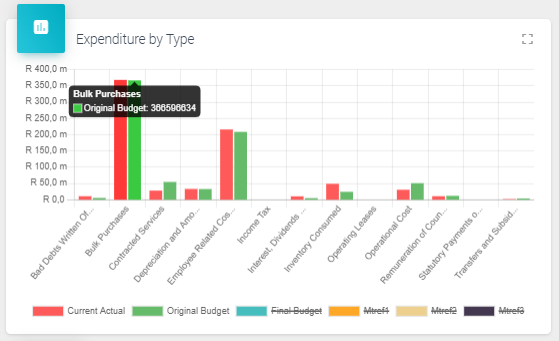
Interactive summary graphs (e.g. Revenue by type, Expenditure by type, Municipal running costs).
The data legends can be activated / de-activated to show only the applicable view required (e.g. comparing actual vs budget).
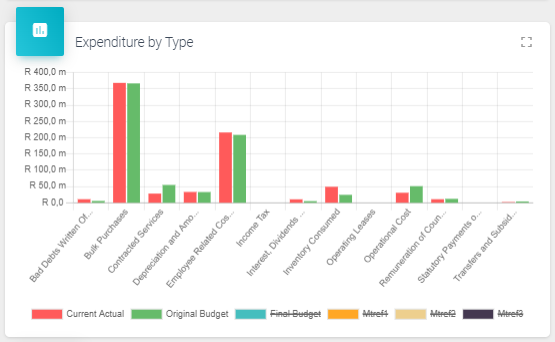
A full screen size of the graph is available by clicking the ‘expand’ in the top right corner.
When the mouse cursor is over a specific data set, the values are also shown.